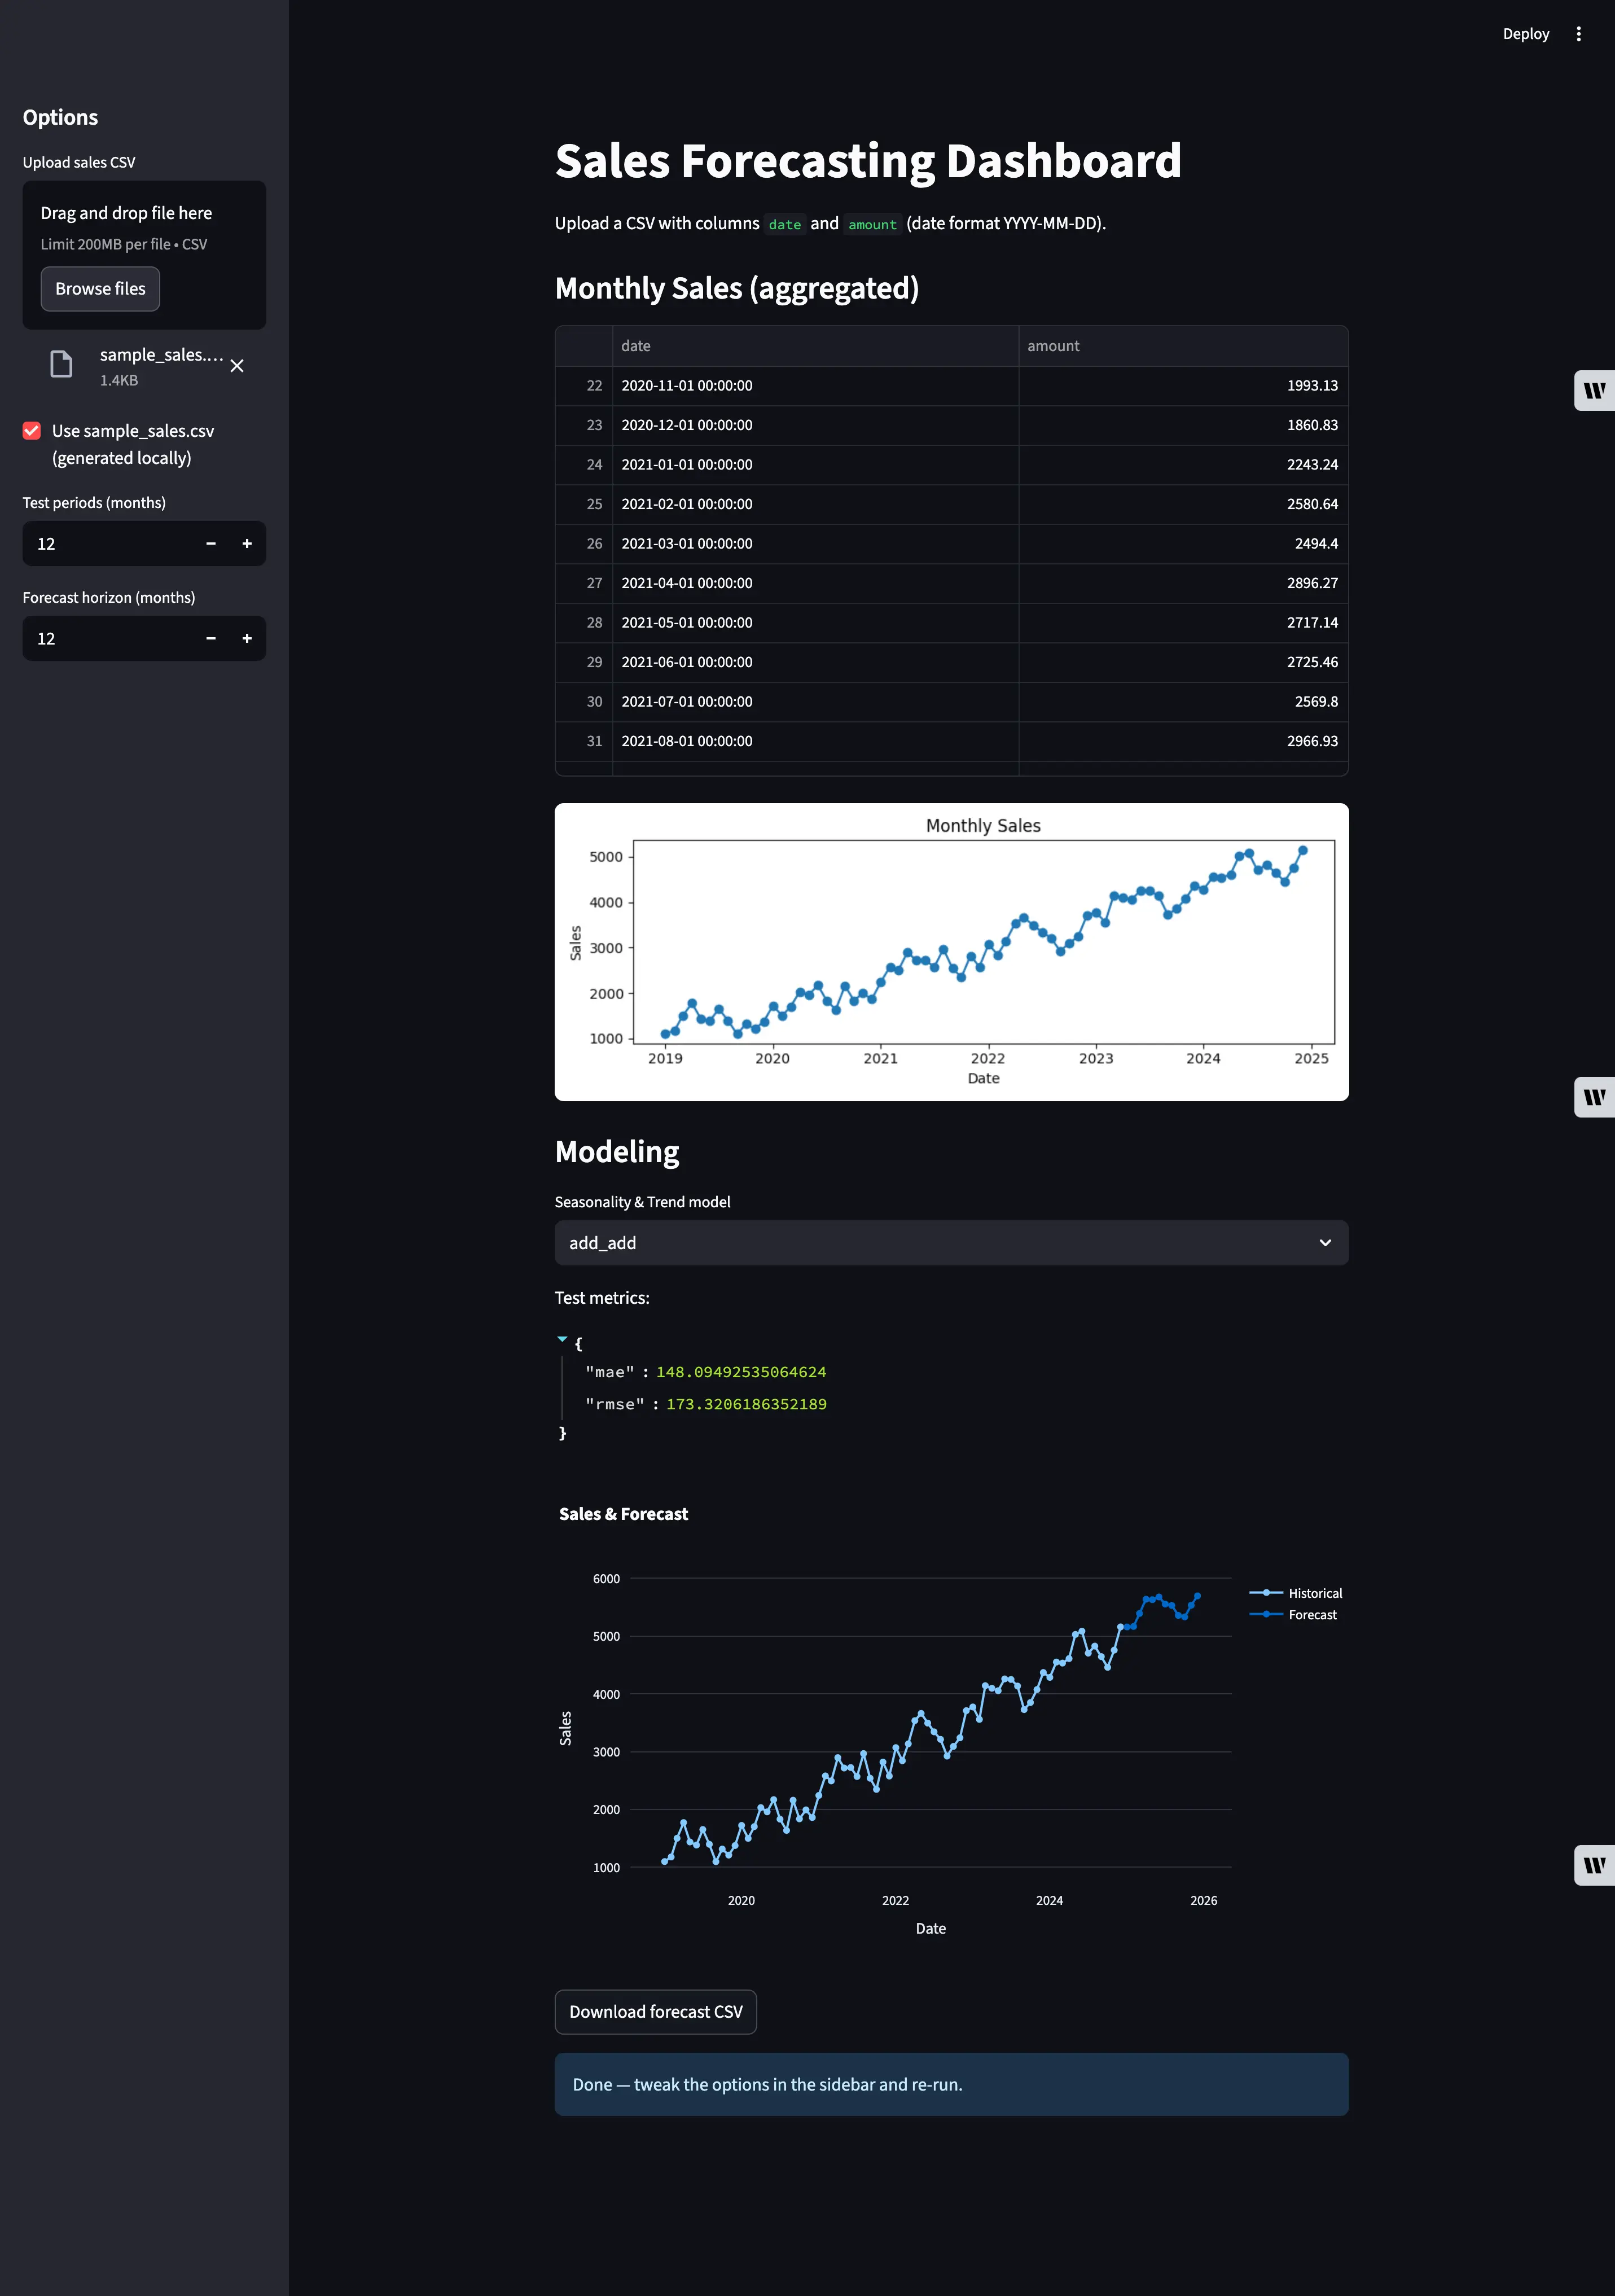
📊 Sales Forecasting Dashboard with Python & Streamlit
As part of my data science and full-stack development portfolio, I built an interactive Sales Forecasting Dashboard using Python, Pandas, Matplotlib, Plotly, and Streamlit.
This project demonstrates how I combine data science techniques, clean code, and modern deployment to deliver business-ready solutions.
---
🔍 Why This Project?
In real-world businesses, forecasting sales helps drive:
- Inventory planning
- Financial forecasting
- Decision-making for growth
Recruiters and hiring managers can see my ability to:
- Clean and preprocess datasets with Pandas
- Perform time-series forecasting using Holt-Winters models
- Build interactive dashboards with Plotly
- Deploy apps using Streamlit Cloud
---
🛠 Tech Stack
- Python 3.12
- Pandas & NumPy (data cleaning & transformation)
- Matplotlib & Plotly (data visualization)
- Statsmodels (Holt-Winters) (time-series forecasting)
- Scikit-learn (metrics evaluation)
- Streamlit (frontend & deployment)
---
🚀 Features
✅ Upload your own CSV or use sample data
✅ Automatic monthly aggregation of sales data
✅ Forecasting with Holt-Winters Exponential Smoothing
✅ Interactive Plotly charts + static Matplotlib plots
✅ Downloadable forecast results in CSV format
✅ Easy one-click deployment on Streamlit Cloud
---
📂 Project Workflow
1. Data Collection – Upload or generate sales data (CSV)
2. Data Preprocessing – Clean, aggregate monthly values
3. Modeling – Apply Holt-Winters Exponential Smoothing
4. Evaluation – MAE & RMSE metrics on test set
5. Visualization – Interactive time-series plots in Plotly
6. Deployment – Hosted via Streamlit for instant demo
---
🌐 Live Demo
👉 Click here to try the Sales Forecasting Dashboard
---
🎯 Key Takeaways
This project highlights my ability to:
- Build end-to-end data science applications
- Apply machine learning for time series forecasting
- Deploy interactive dashboards for business decision-making
- Combine data science, full-stack dev, and UI/UX
